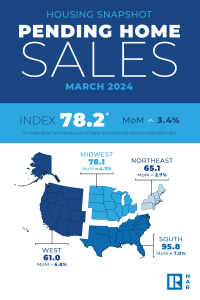
Pending home sales in March climbed 3.4%, according to the National Association of REALTORS®. The Northeast, South and West posted monthly gains in transactions while the Midwest recorded a loss. Year-over-year, the Northeast and South registered decreases but the Midwest and West improved.
The Pending Home Sales Index (PHSI)* – a forward-looking indicator of home sales based on contract signings – increased to 78.2 in March. Year over year, pending transactions were up 0.1%. An index of 100 is equal to the level of contract activity in 2001.
"March's Pending Home Sales Index – at 78.2 – marks the best performance in a year, but it still remains in a fairly narrow range over the last 12 months without a measurable breakout," said NAR Chief Economist Lawrence Yun. "Meaningful gains will only occur with declining mortgage rates and rising inventory."
Quarterly U.S. Economic Forecast
NAR forecasts that existing-home sales will rise by 9% in 2024 to 4.46 million (from 4.09 million 2023) and another 13.2% in 2025 to 5.05 million (from 2024). Housing starts are expected to rise by 1.2% in 2024 to 1.43 million (from 1.413 million in 2023) and 4.9% to 1.5 million in 2025 (from 2024).
"Home sales have lingered at 30-year lows, and since 70 million more Americans live in the country now compared to three decades ago, it's inevitable that sales will rise in coming years," explained Yun. "Inventory will grow steadily from more home construction, and various life-changing events will require people to trade up, trade down or move to another location."
NAR expects that median home prices will increase by 1.8% in 2024 to a record of $396,800 (from $389,800 in 2023) and another 1.8% in 2025 to $403,800 (from 2024). NAR forecasts a modest reduction – 0.6% – in the median new home price to $426,100 in 2024 (from $428,600 in 2023), reflecting the building of smaller-sized homes. The association anticipates the median new home price will jump 3.4% to $440,500 in 2025 (from 2024).
"Home prices are expected to rise roughly in line with consumer price inflation and wage growth over the next two years," added Yun. "Most homeowners are on strong financial footing in current market conditions, with only 2% of sales classified as being distressed."
NAR expects home sales to steadily improve while home prices continue to hit record highs.
"Job gains, steady mortgage rates and the release of inventory from pent-up home sellers will lead to more sales," explained Yun. "Given the lingering housing shortage, home prices will march higher, albeit much more slowly than in the past."
Pending Home Sales Regional Breakdown
The Northeast PHSI increased 2.7% from last month to 65.1, a decline of 0.3% from March 2023. The Midwest index fell 4.3% to 78.1 in March, up 1.3% from one year ago.
The South PHSI improved 7.0% to 95.8 in March, dropping 1.5% from the prior year. The West index rose 6.8% in March to 61.0, up 3.6% from March 2023.
"Home prices rising faster than income growth is not healthy and adds challenges for first-time buyers," said Yun.
Yun further noted, "Inventory will gradually rise from recent growth in home building. Additionally, many sellers who delayed listing in the past two years will start putting their homes on the market to move to a different home that better fits their new life circumstances – such as changes in family composition, jobs, commuting patterns and retirees wanting to be closer to their grandkids."
*The Pending Home Sales Index is a leading indicator for the housing sector, based on pending sales of existing homes. A sale is listed as pending when the contract has been signed but the transaction has not closed, though the sale usually is finalized within one or two months of signing.
Pending contracts are good early indicators of upcoming sales closings. However, the amount of time between pending contracts and completed sales is not identical for all home sales. Variations in the length of the process from pending contract to closed sale can be caused by issues such as buyer difficulties with obtaining mortgage financing, home inspection problems, or appraisal issues.
The index is based on a sample that covers about 40% of multiple listing service data each month. In developing the model for the index, it was demonstrated that the level of monthly sales-contract activity parallels the level of closed existing-home sales in the following two months.
An index of 100 is equal to the average level of contract activity during 2001, which was the first year to be examined. By coincidence, the volume of existing-home sales in 2001 fell within the range of 5.0 to 5.5 million, which is considered normal for the current U.S. population.
NOTE: Existing-Home Sales for April will be released May 22. The next Pending Home Sales Index will be released May 30. All release times are 10 a.m. Eastern. View the NAR Statistical News Release Schedule.
